Three weeks ago I went back to Canada to accompany my high school on their trip to the American Computer Science League finals. Both of the teams did very well and it was a pleasure to be involved with such bright kids, not to mention the trip was a great opportunity to catch up on my StarCraft!
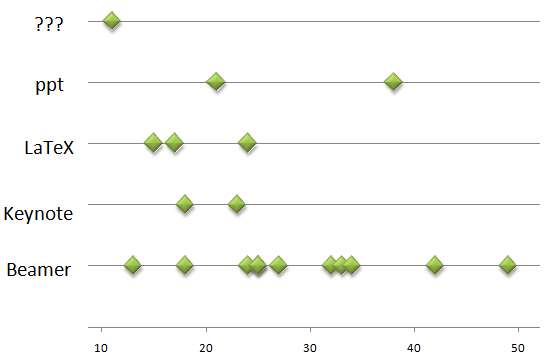
The past week I returned to EPFL, which was home this year to the 14th conference on Integer Programming & Combinatorial Optimization. Inspired by my colleague Cora’s recent display of statistical information, I decided to keep track of what programs people used to give their presentations, and where possible, the number of slides. Out of 34 talks, 18 were in beamer, 3 were in keynote, 4 were in some other type of LaTeX, 6 were in powerpoint, and 3 I could not classify.
Here is the data on the length (in slides), where it was available:

I found that my 21 slides fully used up the 25-30 minute time period for the talk, although I also saw a 13-slider and a 38-slider which were very well timed. What’s the difference between these talks? More information per slide? Am I a fast-talker or a slow-talker? At least I don’t think I am a close-talker.
My talk (joint with Deeparnab Chakrabarty and Jochen Könemann who was my PhD advisor) was on linear programming relaxations for the Steiner Tree problem. The central idea is to take the “full component” method which has underlied most algorithmic progress on the problem for the last 20 years, and use it with linear programming. We found a large number of previously unnoticed links between existing work, and proposed a couple of algorithms whose analysis provide quantified lower bounds on the strength of the relaxation.